California’s School Finance Reforms Target More Funding to Poor Students
by Heather Rose and Margaret Weston, UC Davis
In July 2013, California Governor Jerry Brown overhauled the state’s school finance system, which has long been criticized for its complexity and failure to meet student needs. The prior system generally did provide more revenues to districts serving many disadvantaged students, but the new Local Control Funding Formula (LCFF) dramatically increases the state’s investment in those districts, and creates a more transparent and equitable school finance system.
This policy brief, based on ongoing research by Faculty Affiliate Heather Rose and Graduate Student Researcher Margaret Weston, compares future funding under the LCFF to funding under the old finance system.
Key Findings
- The LCFF consolidates most state funding programs, increases investment particularly in disadvantaged students and reduces funding variation between similar districts.
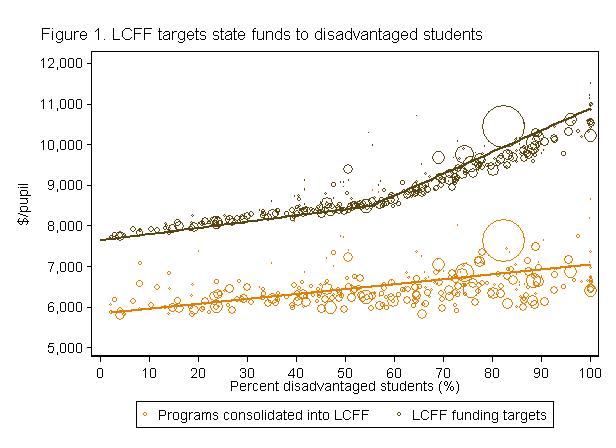
- The prior system provided $7,000 per pupil in districts with all disadvantaged students, which is about 14% higher than the average of $6,100 in districts with no disadvantaged students.
- Under the new system, funding per student in districts with all disadvantaged students will average 43% higher than in those with no disadvantaged students.
Under the old system, school districts received funds from four main sources: a “revenue limit” for general purposes financed by property taxes and state aid; local revenues such as parcel taxes; state categorical aid from about 80 programs for special purposes like special education or gifted and talented education (GATE); and federal aid supporting programs like the National School Lunch Program and Title I.
Revenue limit funds flowed equally between affluent and low-income school districts. Local revenues were more likely to be raised by more affluent districts. State categorical and federal aid overwhelmingly flowed to largely disadvantaged districts.1 Districts with all low-income students received 34 percent more total revenue per pupil on average than districts with no disadvantaged students.
Despite these additional funds, proficiency rates and Academic Performance Index ratings in low-income districts remained much lower than in more affluent districts. This achievement gap, as well as the lack of clear reasons for the funding differences, prompted Governor Brown to propose the Local Control Funding Formula (LCFF).
The Local Control Funding Formula
The LCFF consolidates revenue limits and the majority of state
categorical programs into a new statewide formula that provides
base funding for students statewide, with additional funding for
disadvantaged students. Districts in which more than 55 percent
of the students are disadvantaged would receive even more funding
through a concentration grant. The LCFF defines disadvantaged
students as low-income based on eligibility for free or
reduced-price lunch, English learners and foster youth.
The LCFF’s base rates average $7,650 per pupil. Disadvantaged students generate an additional 20 percent of the base (about $1,530 per pupil). In districts with more than 55 percent disadvantaged students, each additional student generates an extra 50 percent of the base (about $3,820 per pupil). Two large categorical programs for pupil transportation and desegregation remain as a general purpose add-on, meaning those funds are considered part of the LCFF but can now be spent for any educational purpose.
Comparing the Two Systems
Figure 1 shows the distribution of revenue by disadvantaged
students under the old school funding system and under full
implementation of the LCFF. The steepness of the line shows the
change in funding as the fraction of disadvantaged students in a
district increases. The distance between the bubbles and the line
shows funding variation between districts.
The prior funding system provided an additional 14 percent of funds per disadvantaged student on average, but with substantial variation around that average. This variation meant that districts with similar levels of disadvantaged students often received different levels of funding. As the graph shows, upon full implementation of the LCFF, districts of all sizes align more closely to the average funds per pupil. Also, average funds for districts with more disadvantaged students increases sharply, as indicated by the steeper portion of the line representing funding under LCFF.
Under the LCFF, base funding will be higher for all students, and districts composed entirely of disadvantaged students will receive 43 percent more revenue per pupil from the LCFF than those with no disadvantaged students. Furthermore, there will be minimal variation in funding for districts with the same share of disadvantaged students.
Considering the additional state, federal, and local funds that are not part of the LCFF, the average difference in total funding per pupil between a district with all disadvantaged students and a district with none will be about 56 percent.
Conclusion
California is among a growing number of states adopting formulas
that direct more revenue to disadvantaged students. However,
unlike in other states, where the majority of revenue is raised
locally, the vast majority of California school revenue is
controlled by the state. Even local property taxes are determined
by the Proposition 13, which gives school districts few options
to increase or control their funding.
The state cannot afford to meet the LCFF targets this year, so the formula is expected to be phased-in over the next eight years using new revenues from Proposition 30 (2012) and an improving state economy. Once fully implemented, all districts are guaranteed to at least return to their pre-recession levels.3 Other states will be watching as California implements such a pronounced policy change.
Meet the Researchers
Healther Rose is an Associate Professor at the
University of California at Davis. Her research interests focus
on school finance policy, how math curriculum relates to
students’ future test scores and earnings, and affirmative action
policies in higher education.
Margaret Weston is pursuing a Ph.D. in education policy at UC Davis. She is also a Research Fellow at the Public Policy Institute of California.
References
and Notes
Rose, H. & Weston, M.
(2013). “School District Revenue and Student Poverty: Moving
Toward a Weighted Pupil Funding Formula.” San Francisco: Public
Policy Institute of California.
Note: In
approximately 20% of districts, the LCFF target is lower than
what that school district would have received under the old
formula. To address this, the LCFF creates an “economic recovery
target” to ensure that funding in these districts increases to at
least to pre-recession levels, capped at $14,500 per
pupil.
Graph data source:
PPIC School Finance Model (2013); Assembly Bill 97 (Chapter 47,
Statutes of 2013).
Graph data note:
Excludes 20 districts (serving approximately 10,400 students)
with current funds greater than $12,000 per pupil and 4 districts
(serving approximately 300 students) with projected LCFF funds
greater than $12,000 per pupil. Average relationship is weighted
by district size. The estimate the percent disadvantaged students
as defined in statute is based on a sum of the percent of
students on free or reduced price lunch and 25% of the English
learners. This estimate is based on testimony from the Department
of Finance (February 16, 2012) to the Senate Standing Committee
on Budget and Fiscal Review that 75% of English learners also
qualify for free and reduced price lunch.


