What is the history of the minimum wage?
Background from official sources
A minimum wage is the lowest wage that employers may legally pay to workers. The first minimum wage law was enacted in 1894 in New Zealand.
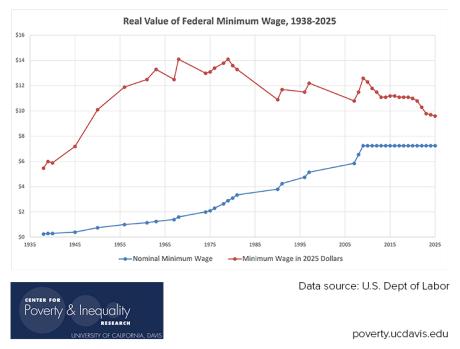
With the passage of The Fair Labor Standards Act of 1938 (FLSA), the U.S. minimum wage was initially set at $0.25 per hour for covered workers. Since then, it has been raised 22 separate times–most recently, in July 2009, to $7.25 an hour.
FSLA provided a number of federal protections for the first time including
- payment of the minimum wage
- overtime pay for time worked over a set number of hours in a work week
- restrictions on the employment of children
- recordkeeping requirements
In 1938, the act applied to industries whose combined employment represented about 20 percent of the labor force. Coverage has been expanded over time. According to the Congressional Research Service, approximately 85 percent of wage and salary workers are covered under FLSA minimum wage provisions.
State Minimum Wage Laws
A number of states have their own state minimum wage laws.
Five Southern states (Louisiana, Mississippi, Alabama, Tennessee and South Carolina) have no minimum wage laws.
Three states (Georgia, Oklahoma and Wyoming) have state minimum wage rates that are lower than the federal rate; these states default to the federal minimum wage of $7.25 per hour.
Many states set their own rates higher than the federal rate. As of 2025, dozens of states and the District of Columbia have minimum wages above the federal minimum. For example:
- California has a statewide minimum wage of $16.50 per hour (with local jurisdictions often higher).
- District of Columbia has the highest jurisdiction-wide minimum wage at $17.95 per hour.
- New York City and certain surrounding counties have minimum wages around $16.50–$17.00 per hour.
- Numerous states (e.g., Colorado, Washington, Connecticut, Massachusetts, Maine) have rates ranging from approximately $14.65 to above $16 per hour.
The federal minimum wage ($7.25) remains the baseline where states do not set higher rates.
Statistical Publications
The U.S. Department of Labor Wage and Hours Division provides data on federal and state minimum wage rates, both current and historical: History of Federal Minimum Wage Rates Under the Fair Labor Standards Act, 1938 – 2009 and Changes in Basic Minimum Wages in Non-Farm Employment under State Law: Selected Years 1968 to 2024.
The U.S. Bureau of Labor Statistics produces information on the characteristics of minimum wage workers. The annual report Characteristics of Minimum Wage Workers provides national-level statistics on hourly-paid workers with earnings at or below the prevailing federal minimum wage. In 2023, approximately 80.5 million workers age 16 and older were paid on an hourly basis, and 81,000 earned exactly the federal minimum wage of $7.25 per hour; about 789,000 earned less than the federal minimum (often due to exemptions or special wage provisions).
The report series derives its information on minimum wage earners from the Current Population Survey (CPS), a key survey conducted jointly by the Bureau of Labor Statistics and the Census Bureau. The CPS is also the source of our official figures on employment and unemployment in the United States.
Recent Government Reports
With the renewed interest in raising the federal minimum wage, the Congressional Research Service (a legislative branch agency within the Library of Congress well-known for analysis that is authoritative, objective and nonpartisan) has recently produced several papers that provide a variety of background information:
- The Federal Minimum Wage: In Brief provides an overview of the law, as well as the arguments for and against raising the minimum wage.
- The Fair Labor Standards Act (FLSA): An Overview provides a more in-depth description of the provisions of the FLSA.
- Inflation and the Real Minimum Wage: A Fact Sheet provides data on the purchasing power (real or constant dollar value) of the minimum wage since its enactment.
- Federal Minimum Wage, Tax-Transfer Earnings Supplements, and Poverty examines the alternatives of raising the federal minimum wage and expanding the Earned Income Tax Credit to address poverty
The Congressional Budget Office (CBO) is another legislative branch agency that provides nonpartisan analysis for Congress. CBO has released an analysis of The Effects of a Minimum-Wage Increase on Employment and Family Income.
Federal Contract Workers Minimum Wage
In recent federal policy developments, the mandatory minimum wage for many federal contractors (previously set at $17.75 per hour by executive order) was rescinded in March 2025; coverage and applicable rates for federal contract workers now vary depending on contract date and applicable federal or state laws.
Updated 12/15/25
Sources:
U.S. Department of Labor. Minimum Wage — Federal and State law overview. Accessed 12/15/25.
National Conference of State Legislatures. State Minimum Wages (updated September 30, 2025). Accessed 12/15/25.
U.S. Bureau of Labor Statistics. Characteristics of Minimum Wage Workers, 2023. Accessed 12/15/25.
Congress.gov. The Federal Minimum Wage: In Brief (CRS Report). Accessed 12/15/25.